About the numbers. Every figure in this article comes from an official published source, with the season or year it applies to. Racing Australia notes its figures were correct as of 31 July 2025, with mare return data still coming in, so the most recent seasons may rise slightly. Sections marked Trend commentary are our interpretation, not official forecasts.
Ask ten breeders where Australian horse breeding is heading and you'll get ten answers. The official numbers are a better starting point. They show a thoroughbred industry that is getting smaller in foal numbers and much more concentrated in stallion numbers, a harness industry that is shrinking faster, and a national traceability system that is still being worked out.
This article goes through what the data shows, the rules that shape thoroughbred breeding, and what those trends could mean for studs, mare owners and the businesses that serve them.
Thoroughbred foal numbers: a slow decline
Racing Australia's Fact Book reports breeding figures by covering season. The live foals from a season are born the following year, so the 2023/24 season produced the 2024 foal crop.
| Covering season | Stallions returned | Mares covered | Live foals | Live foals / mares returned |
|---|---|---|---|---|
| 2014/15 | 668 | 19,386 | 12,992 | 59.35% |
| 2015/16 | 646 | 19,424 | 12,858 | 60.10% |
| 2016/17 | 618 | 19,519 | 13,097 | 61.58% |
| 2017/18 | 613 | 20,219 | 13,226 | 62.15% |
| 2018/19 | 585 | 20,356 | 13,201 | 62.23% |
| 2019/20 | 504 | 19,897 | 12,805 | 61.58% |
| 2020/21 | 529 | 19,725 | 12,857 | 63.01% |
| 2021/22 | 525 | 20,287 | 13,340 | 64.66% |
| 2022/23 | 503 | 19,446 | 12,594 | 63.71% |
| 2023/24 | 440 | 18,139 | 11,691 | 66.02% |
Source: Racing Australia Fact Book 2024/25, Table 14 [1].
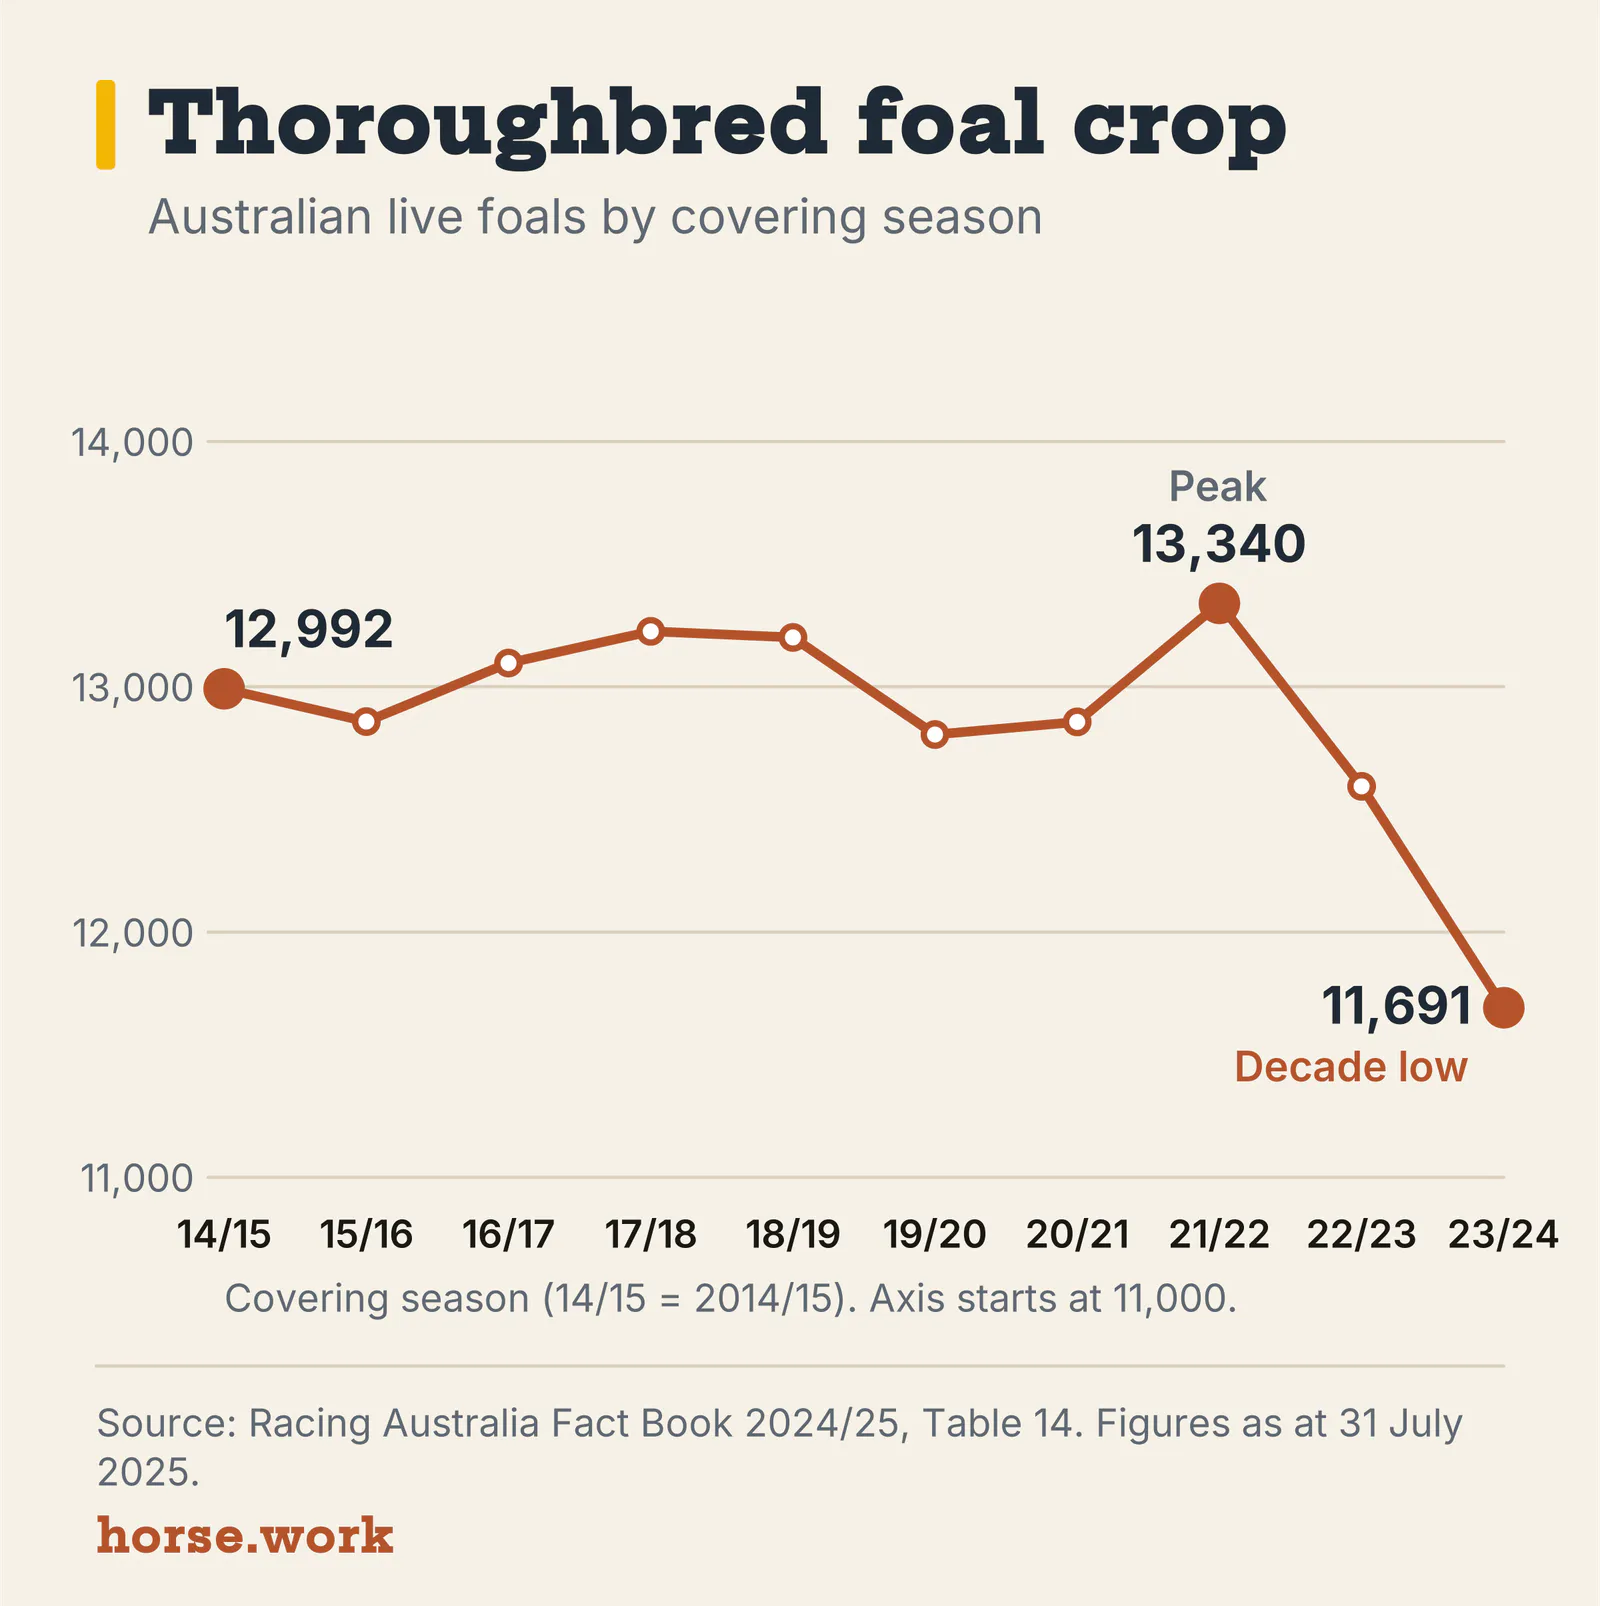
What stands out:
- Live foals. The 2023/24 season produced 11,691 live foals, the lowest figure in the 10 seasons shown. That's 12.4% below the 2021/22 peak of 13,340, and 10.0% below 2014/15 (our calculation from [1]).
- Mares covered. Coverings peaked at 20,356 in 2018/19 and were 18,139 in 2023/24, a drop of about 11% (our calculation from [1]).
- Better results per mare. Live foals as a share of mares returned rose from 59.35% in 2014/15 to 66.02% in 2023/24 [1]. Racing Australia doesn't explain the change, but it means fewer foals isn't simply because fewer mares are getting in foal.
Fewer stallions, bigger books
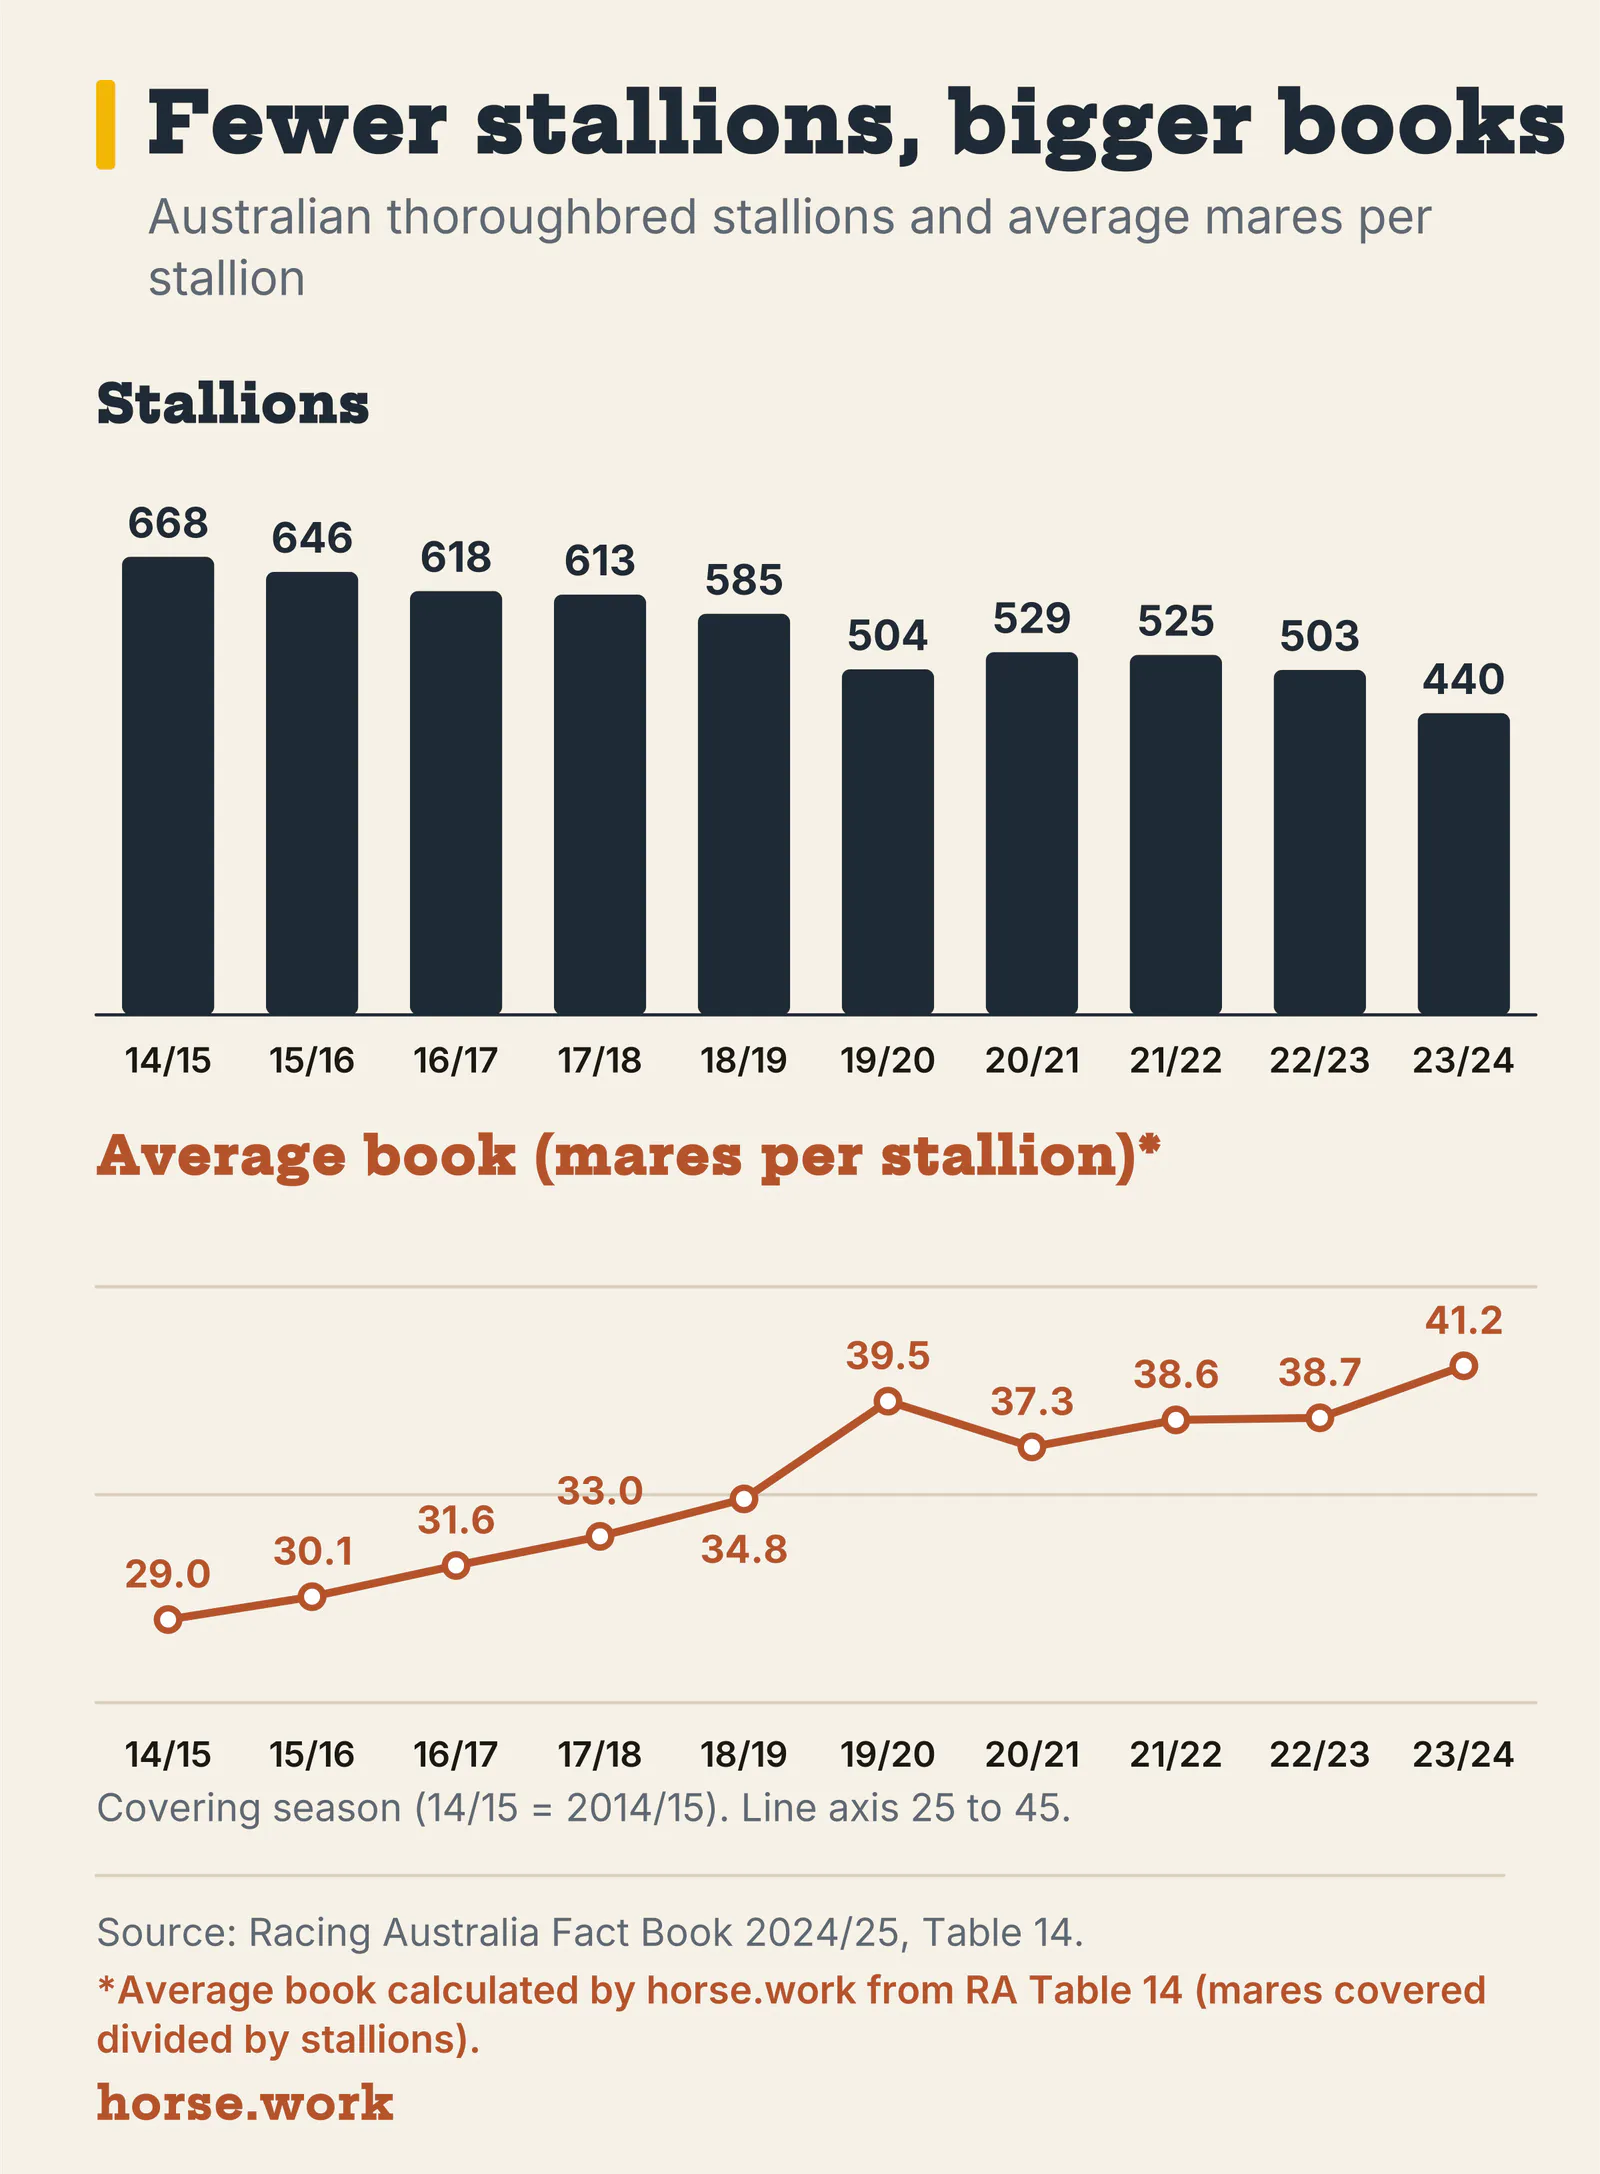
The number of stallions has fallen much faster than the number of mares. Racing Australia recorded 668 stallions in 2014/15 and 440 in 2023/24 [1], a drop of about 34%.
Divide mares covered by stallions and the average book rises from about 29 mares per stallion in 2014/15 to about 41 in 2023/24 (our calculation from [1]). Racing Australia's state table gives a national average book of 41.23 for 2023/24 [2].
Shuttle stallions
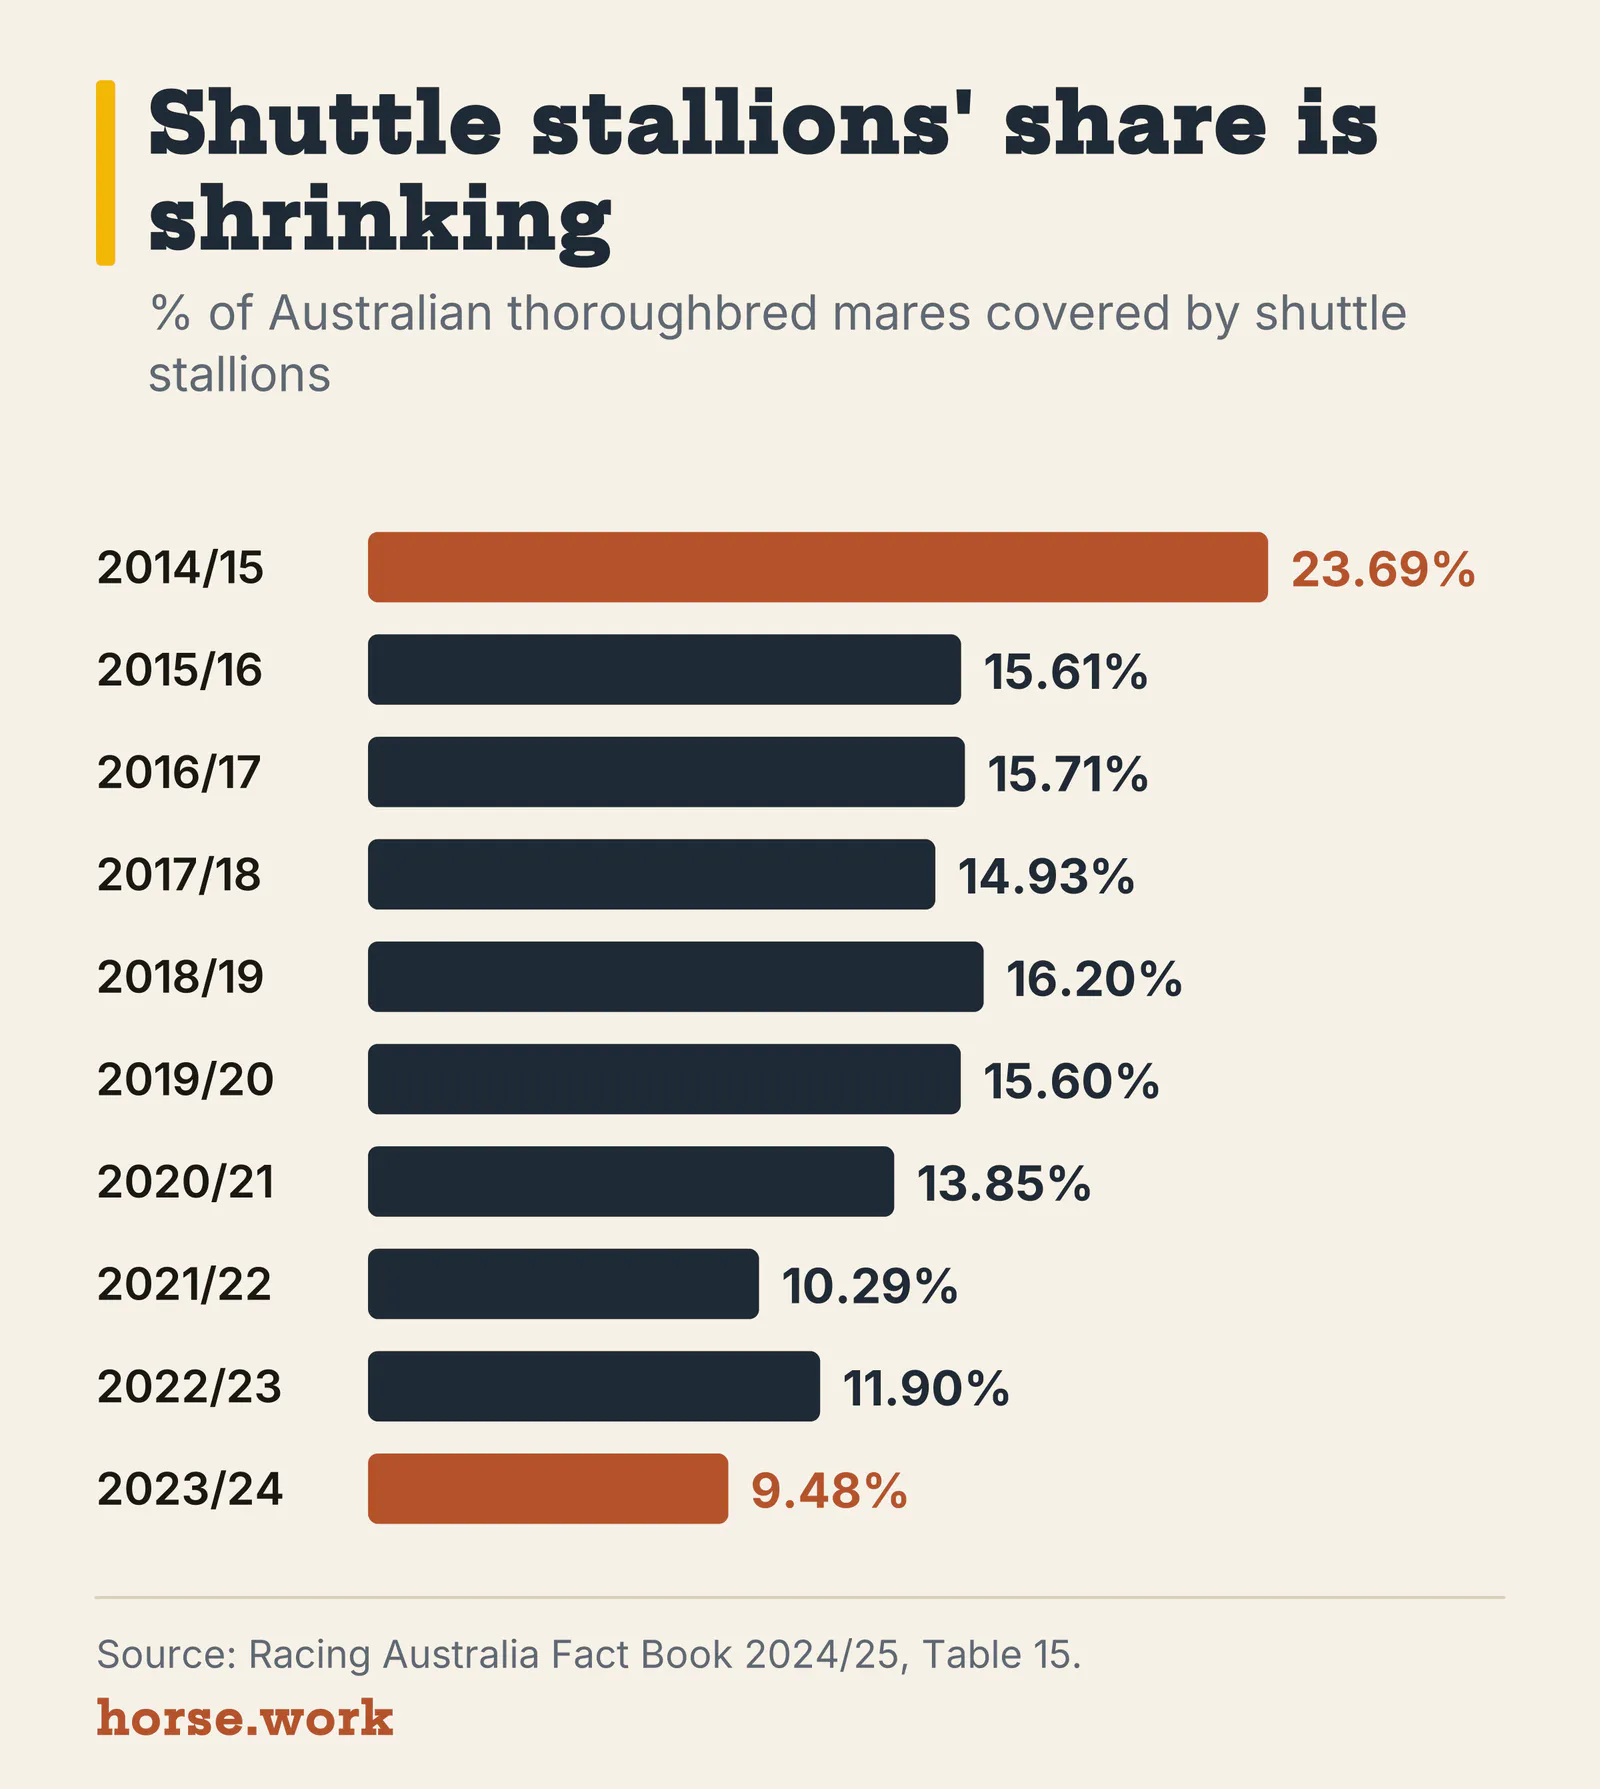
Shuttle stallions, the ones that cover mares in both hemispheres in the same year, have also become less common.
| Covering season | Shuttle stallions | Share of stallions | Mares covered by shuttles | Share of mares covered | Average shuttle book |
|---|---|---|---|---|---|
| 2014/15 | 39 | 5.84% | 4,593 | 23.69% | 118 |
| 2016/17 | 32 | 5.18% | 3,066 | 15.71% | 96 |
| 2018/19 | 36 | 6.15% | 3,297 | 16.20% | 92 |
| 2020/21 | 24 | 4.54% | 2,732 | 13.85% | 114 |
| 2022/23 | 21 | 4.17% | 2,315 | 11.90% | 110 |
| 2023/24 | 15 | 3.41% | 1,720 | 9.48% | 115 |
Source: Racing Australia Fact Book 2024/25, Table 15 [1]. Alternate seasons shown; the full table is in the source.
In 2014/15, almost a quarter of Australian thoroughbred mares were covered by a shuttle stallion. By 2023/24 it was fewer than one in ten [1].
Where the foals are born
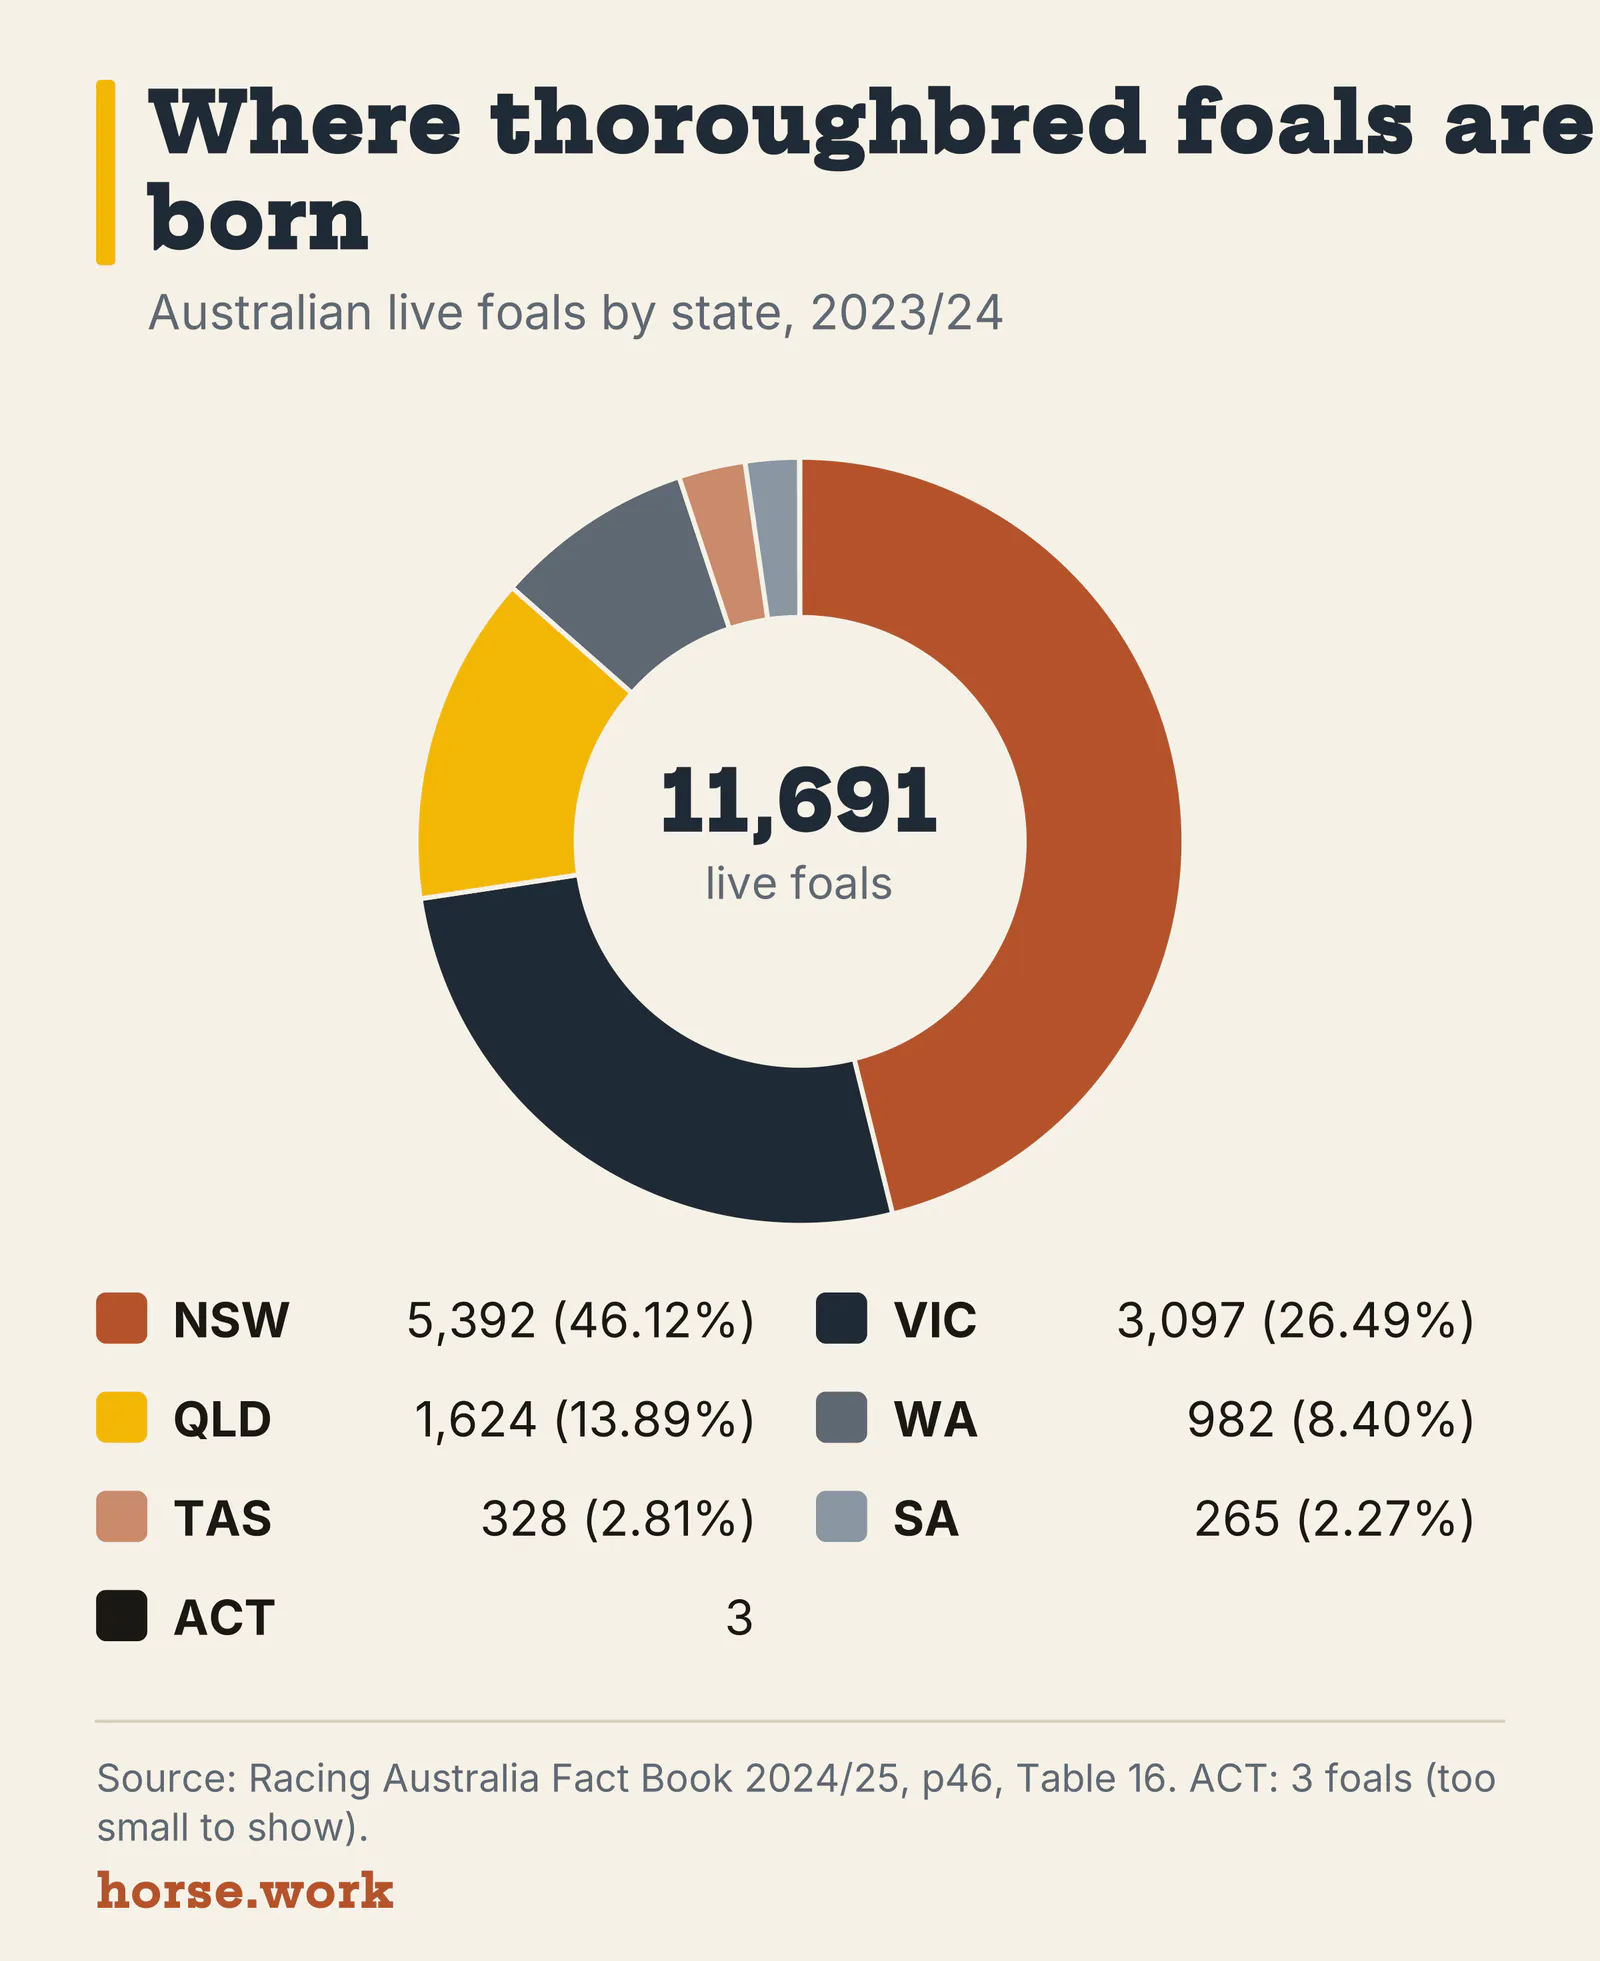
New South Wales dominates. In the 2023/24 season [2]:
| State | Stallions | Live foals | Share of national foals |
|---|---|---|---|
| New South Wales | 152 | 5,392 | 46.12% |
| Victoria | 123 | 3,097 | 26.49% |
| Queensland | 87 | 1,624 | 13.89% |
| Western Australia | 46 | 982 | 8.40% |
| Tasmania | 18 | 328 | 2.81% |
| South Australia | 14 | 265 | 2.27% |
| ACT | 0 | 3 | 0.03% |
| Total | 440 | 11,691 | 100% |
Source: Racing Australia Fact Book 2024/25, Table 16 [2]. Tasmania, SA and ACT shares are our calculation from the foal numbers.
NSW also had the biggest average book, 61.58 mares per stallion [2].
Natural cover only: the Stud Book rule
The biggest rule shaping thoroughbred breeding in Australia is that it must be done by natural cover.
Under the Australian Stud Book rules, a foal can only be registered if it was conceived by natural service, meaning the stallion physically mounted the mare, followed by natural gestation in, and delivery from, the mare that conceived it [3]. The rules allow only one exception: immediate reinforcement with semen left over from that same service. Artificially collected semen isn't allowed. A foal is also ineligible if its sire was used as a semen donor for artificial insemination that season, or if its dam had an artificial breeding procedure within 385 days before the foal was born [3]. (The rules PDF we checked carries a 2016 date in its metadata, so confirm the current version with the Australian Stud Book.)
The Stud Book rules also cover parentage verification and microchipping [3]. The Australian Rules of Racing (version dated 1 October 2026) link racing registration back to the Stud Book, under AR 27, "Stud Book requirement for horse registration" [4].
Trend commentary. Natural cover is a big part of why stallions shuttle, why studs are concentrated in particular regions, and why mares travel to the stallion. Fewer, busier stallions mean more mare movements to the big studs, and more demand for transport, foaling-down and agistment near them. If you're a transporter or agistment host near the major breeding centres, that's your market.
Harness breeding is falling faster
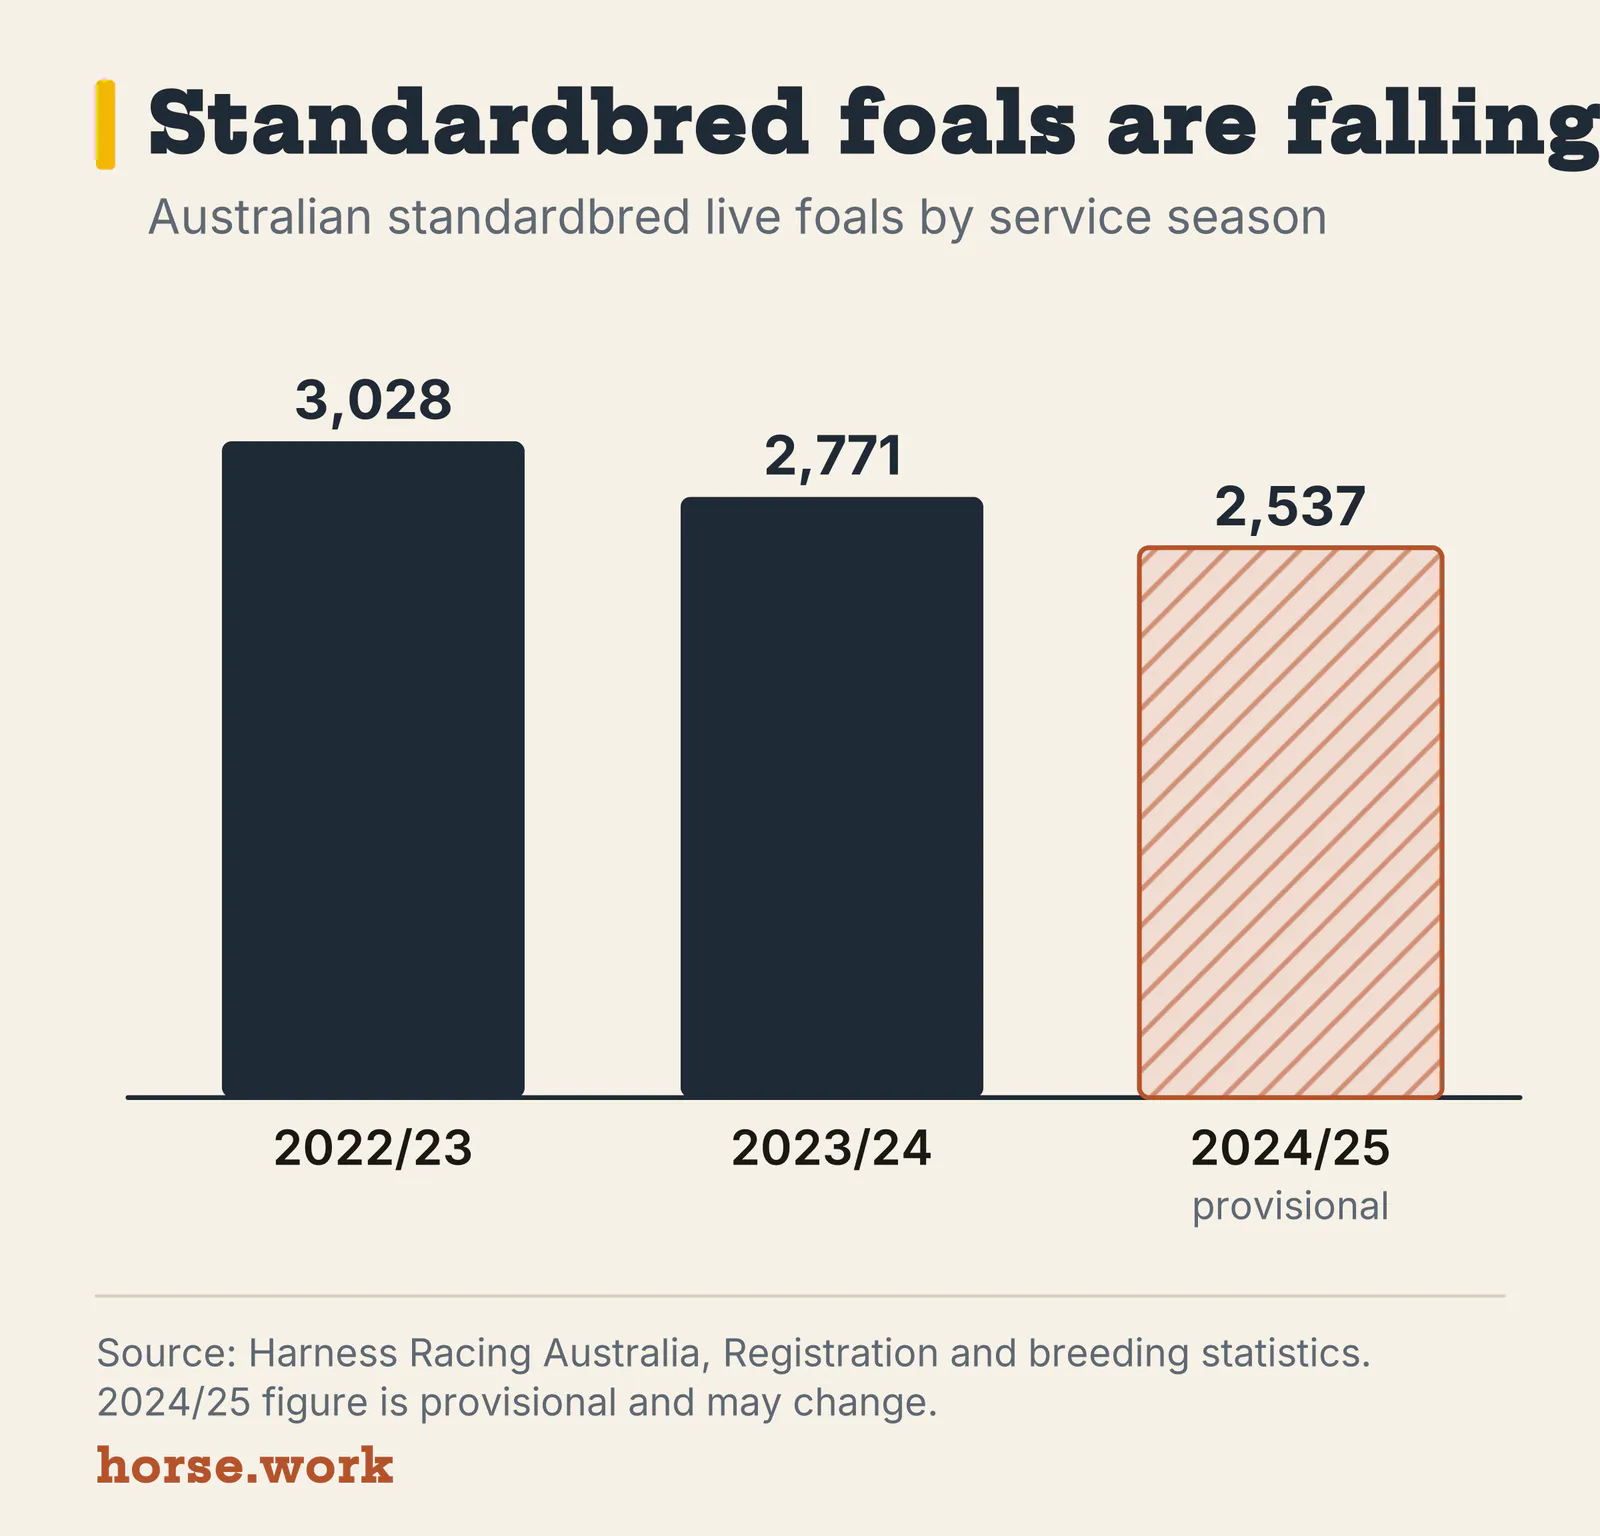
Standardbred breeding has dropped more steeply. Harness Racing Australia's statistics, by covering season [5]:
| Service season | Registered sires | Mares served | Live foals | Shuttle sires (foals) | Embryo transfers |
|---|---|---|---|---|---|
| 2022/23 | 179 | 4,813 | 3,028 | 15 (748) | 20 |
| 2023/24 | 172 | 4,449 | 2,771 | 17 (816) | 41 |
| 2024/25 | 135 | 3,998 | 2,537* | — | 53 |
Source: Harness Racing Australia registration and breeding statistics [5]. *2024/25 foals were born in the 2025/26 season, and HRA's figures may still be updated. HRA notes that embryo transfer numbers "may be under representative".
Mares served fell by about 17% across those two seasons (our calculation from [5]). Pacers dominate: in 2023/24 there were 3,744 pacer services and 705 trotter services [5]. Embryo transfers are a small number, but they more than doubled between 2022/23 and 2024/25 [5].
National horse traceability: still in progress
Australia doesn't yet have an operating national horse traceability register. According to Agriculture Victoria [6]:
- In October 2022, the National Horse Traceability Working Group reached national agreement on a recommended National Horse Traceability System. Agriculture Ministers endorsed the Working Group's recommended approach in their communiqué of 7 December 2022.
- A national implementation taskforce was then set up, led by Victorian biosecurity specialist Dr Ron Glanville, to put the system in place.
- A progress report has gone to governments for national agreement, and implementation discussions are continuing.
Trend commentary. Whatever system is adopted, breeders who already microchip, record movements and keep up-to-date ownership details will find the change easier. Register your property and keep records now.
What could change, and what to watch
Trend commentary. These are our readings of the data above, not forecasts from any official body.
- Fewer, bigger stallion operations. The data shows stallion numbers falling much faster than mare numbers [1]. If that continues, more mares will travel further to fewer studs.
- Shuttling may keep shrinking. Fewer shuttle stallions covered a smaller share of mares in 2023/24 than at any time in the 10 seasons [1]. Watch whether that holds as international travel and biosecurity costs change.
- Better foaling results per mare matter more. With fewer mares covered, each live foal counts. The live-foal rate has improved [1], which points to the value of good mare management, vet care and record-keeping.
- Harness breeders face tougher numbers. HRA's statistics show fewer sires and fewer mares served in each of the two most recent seasons [5].
- Traceability is coming. The national approach is agreed in principle but not finished [6].
We have deliberately left out breeding cost figures such as service fees and keep rates. There's no consolidated official source for them, and they vary widely by stud, region and stallion. For costs that apply to your own horse, ask the stud directly, or use our horse cost calculator for your own budget.
Practical next steps for breeders
- Plan your mare's season early, and use the foaling age calculator to work out key dates.
- Find studs and stallion stations in the studs and breeding directory, including New Zealand.
- Line up an equine vet for pre-breeding checks, pregnancy testing and foaling.
- Book horse transport for walk-on or foaling-down mares well before the peak of the season.
- Check names early with the horse name checker.
- Keep vaccination and health records up to date (see our horse vaccination schedule).
- Talk to an insurance or finance provider about cover for mares and foals.
Breeder's planning checklist
- Confirm the stud, the stallion and the terms in writing before the season
- Check the current Stud Book or breed society rules for your breed
- Book pre-breeding vet checks and plan for pregnancy tests
- Book transport and foaling-down or agistment in advance
- Microchip and register foals as your stud book requires
- Keep movement and ownership records up to date, ready for national traceability